  $ oc get routes jaeger-query -n istio-system
  NAME           HOST/PORT                                    PATH      SERVICES       PORT           TERMINATION   WILDCARD
jaeger-query jaeger-query-istio-system.127.0.0.1.nip.io jaeger-query jaeger-query edge NoneDistributed Tracing
Before you Begin
-
Install Maistra by following the instructions here here.
-
Deploy Bookinfo application by following these instructions.
Generate Traces
Once Bookinfo application has been deployed, generate traces by accessing http://$GATEWAY_URL/productpage a few times.
Analyze Tracing Data using Jaeger
Maistra installer should have created a route to access Jaeger dashboard. Query openshift for details of the route:
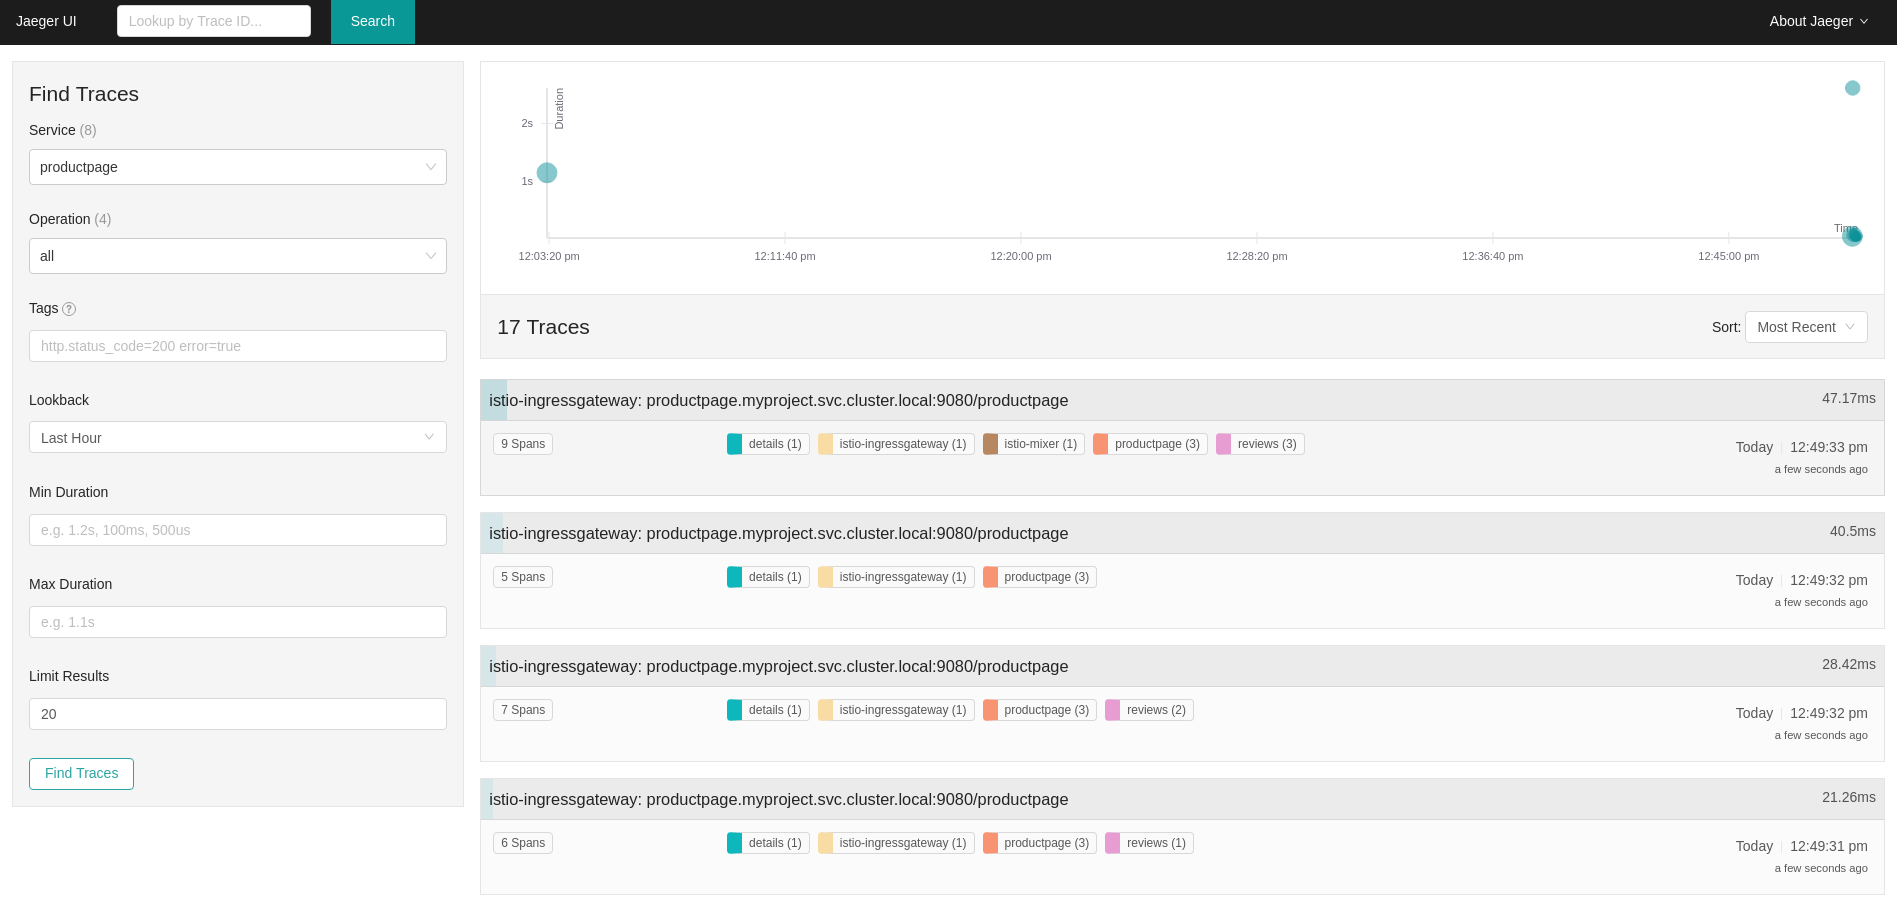
Point your browser to https://jaeger-query-istio-system.127.0.0.1.nip.io, select "productpage" from the "Service" drop-down list, and click "Find Traces". You should see a list of available traces similar to one below:
Click on one of the traces in the list to open a detailed view of that trace:
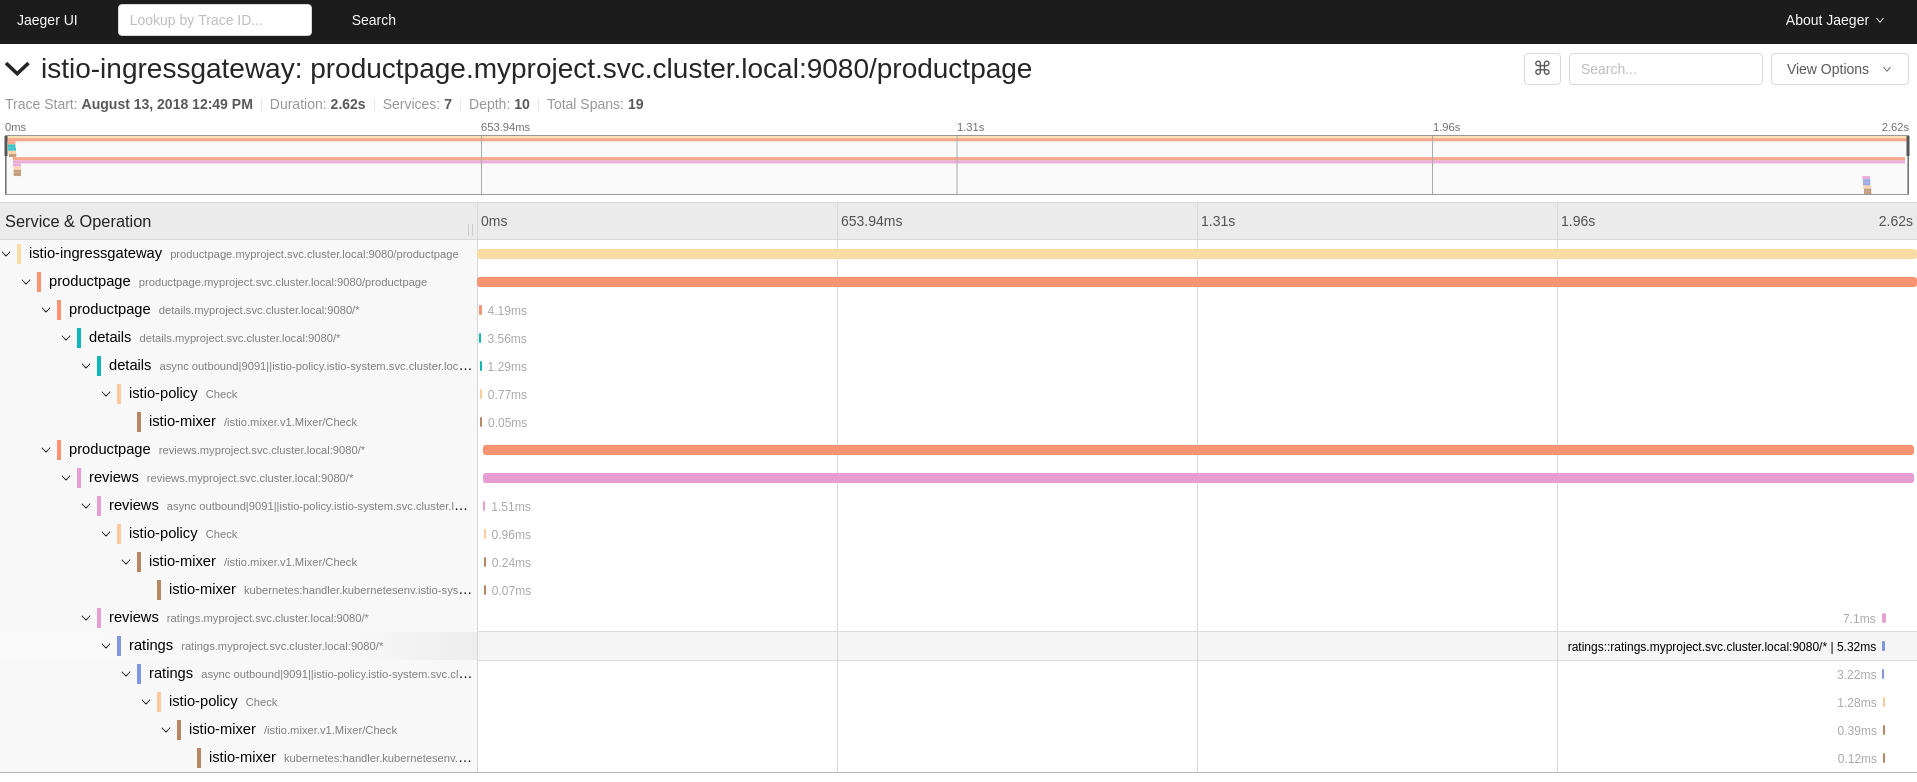
The trace above consists of a few nested spans, each corresponding to a Bookinfo service call, all performed in response to a /productpage request. Overall processing time was 2.62s, with "details" service taking 3.56ms, "reviews" service taking 2.6s, and "ratings" service — 5.32ms. Each of the calls to remote services is represented by a client-side and server-side spans. For example, "details" client-side span is labeled productpage details.myproject.svc.cluster.local:9080. The span nested undeneath it labeled details details.myproject.svc.cluster.local:9080 corresponds to the server-side processing of the request.
The trace also shows calls to "istio-policy" which reflect authorization checks made by istio.
Cleanup
Follow Bookinfo cleanup instructions to remove the application.